Agree the source.
Locate the records in your ERP, sales system or files. Identify the owner, the join keys and the checks that make the dataset usable.
IntegrationsA better view of your business
Start with a question. Find the detail that explains it.
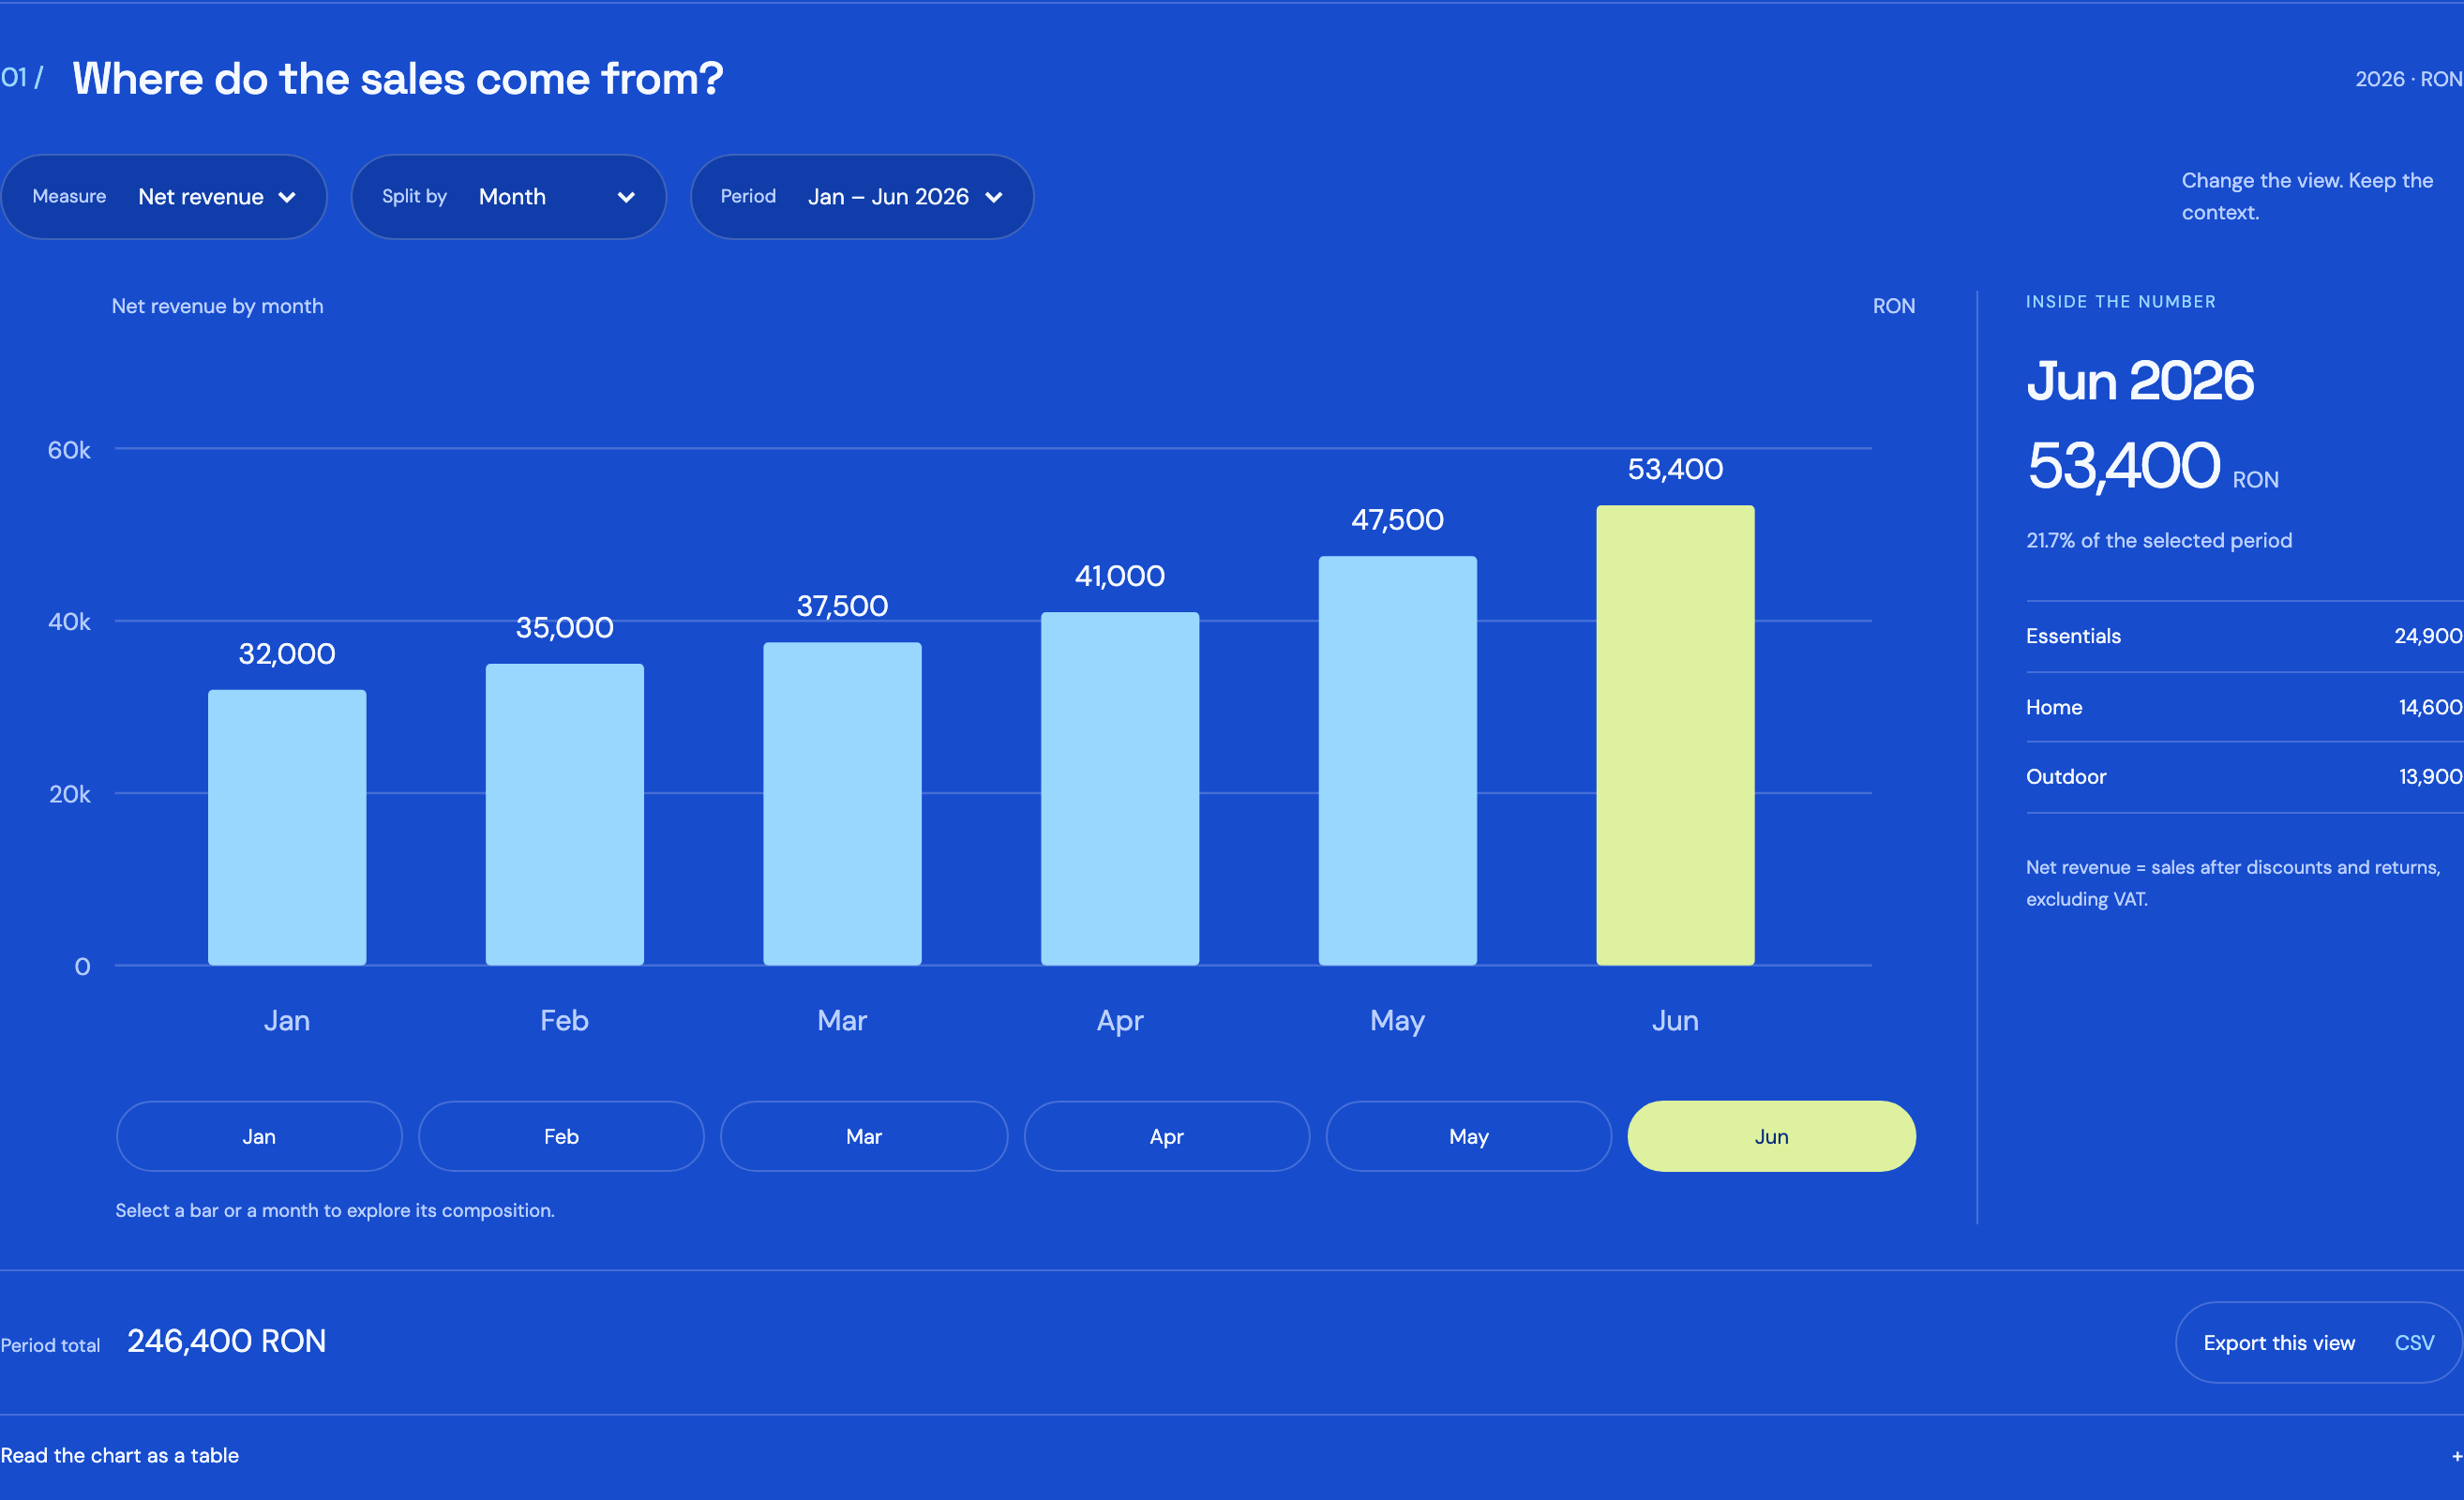
Select a bar or a month to explore its composition.
| Month | Net revenue (RON) |
|---|---|
| Jan | 32,000 |
| Feb | 35,000 |
| Mar | 37,500 |
| Apr | 41,000 |
| May | 47,500 |
| Jun | 53,400 |
Reports built around your sources, definitions and decisions.
Let’s define your first report02 / Follow the question
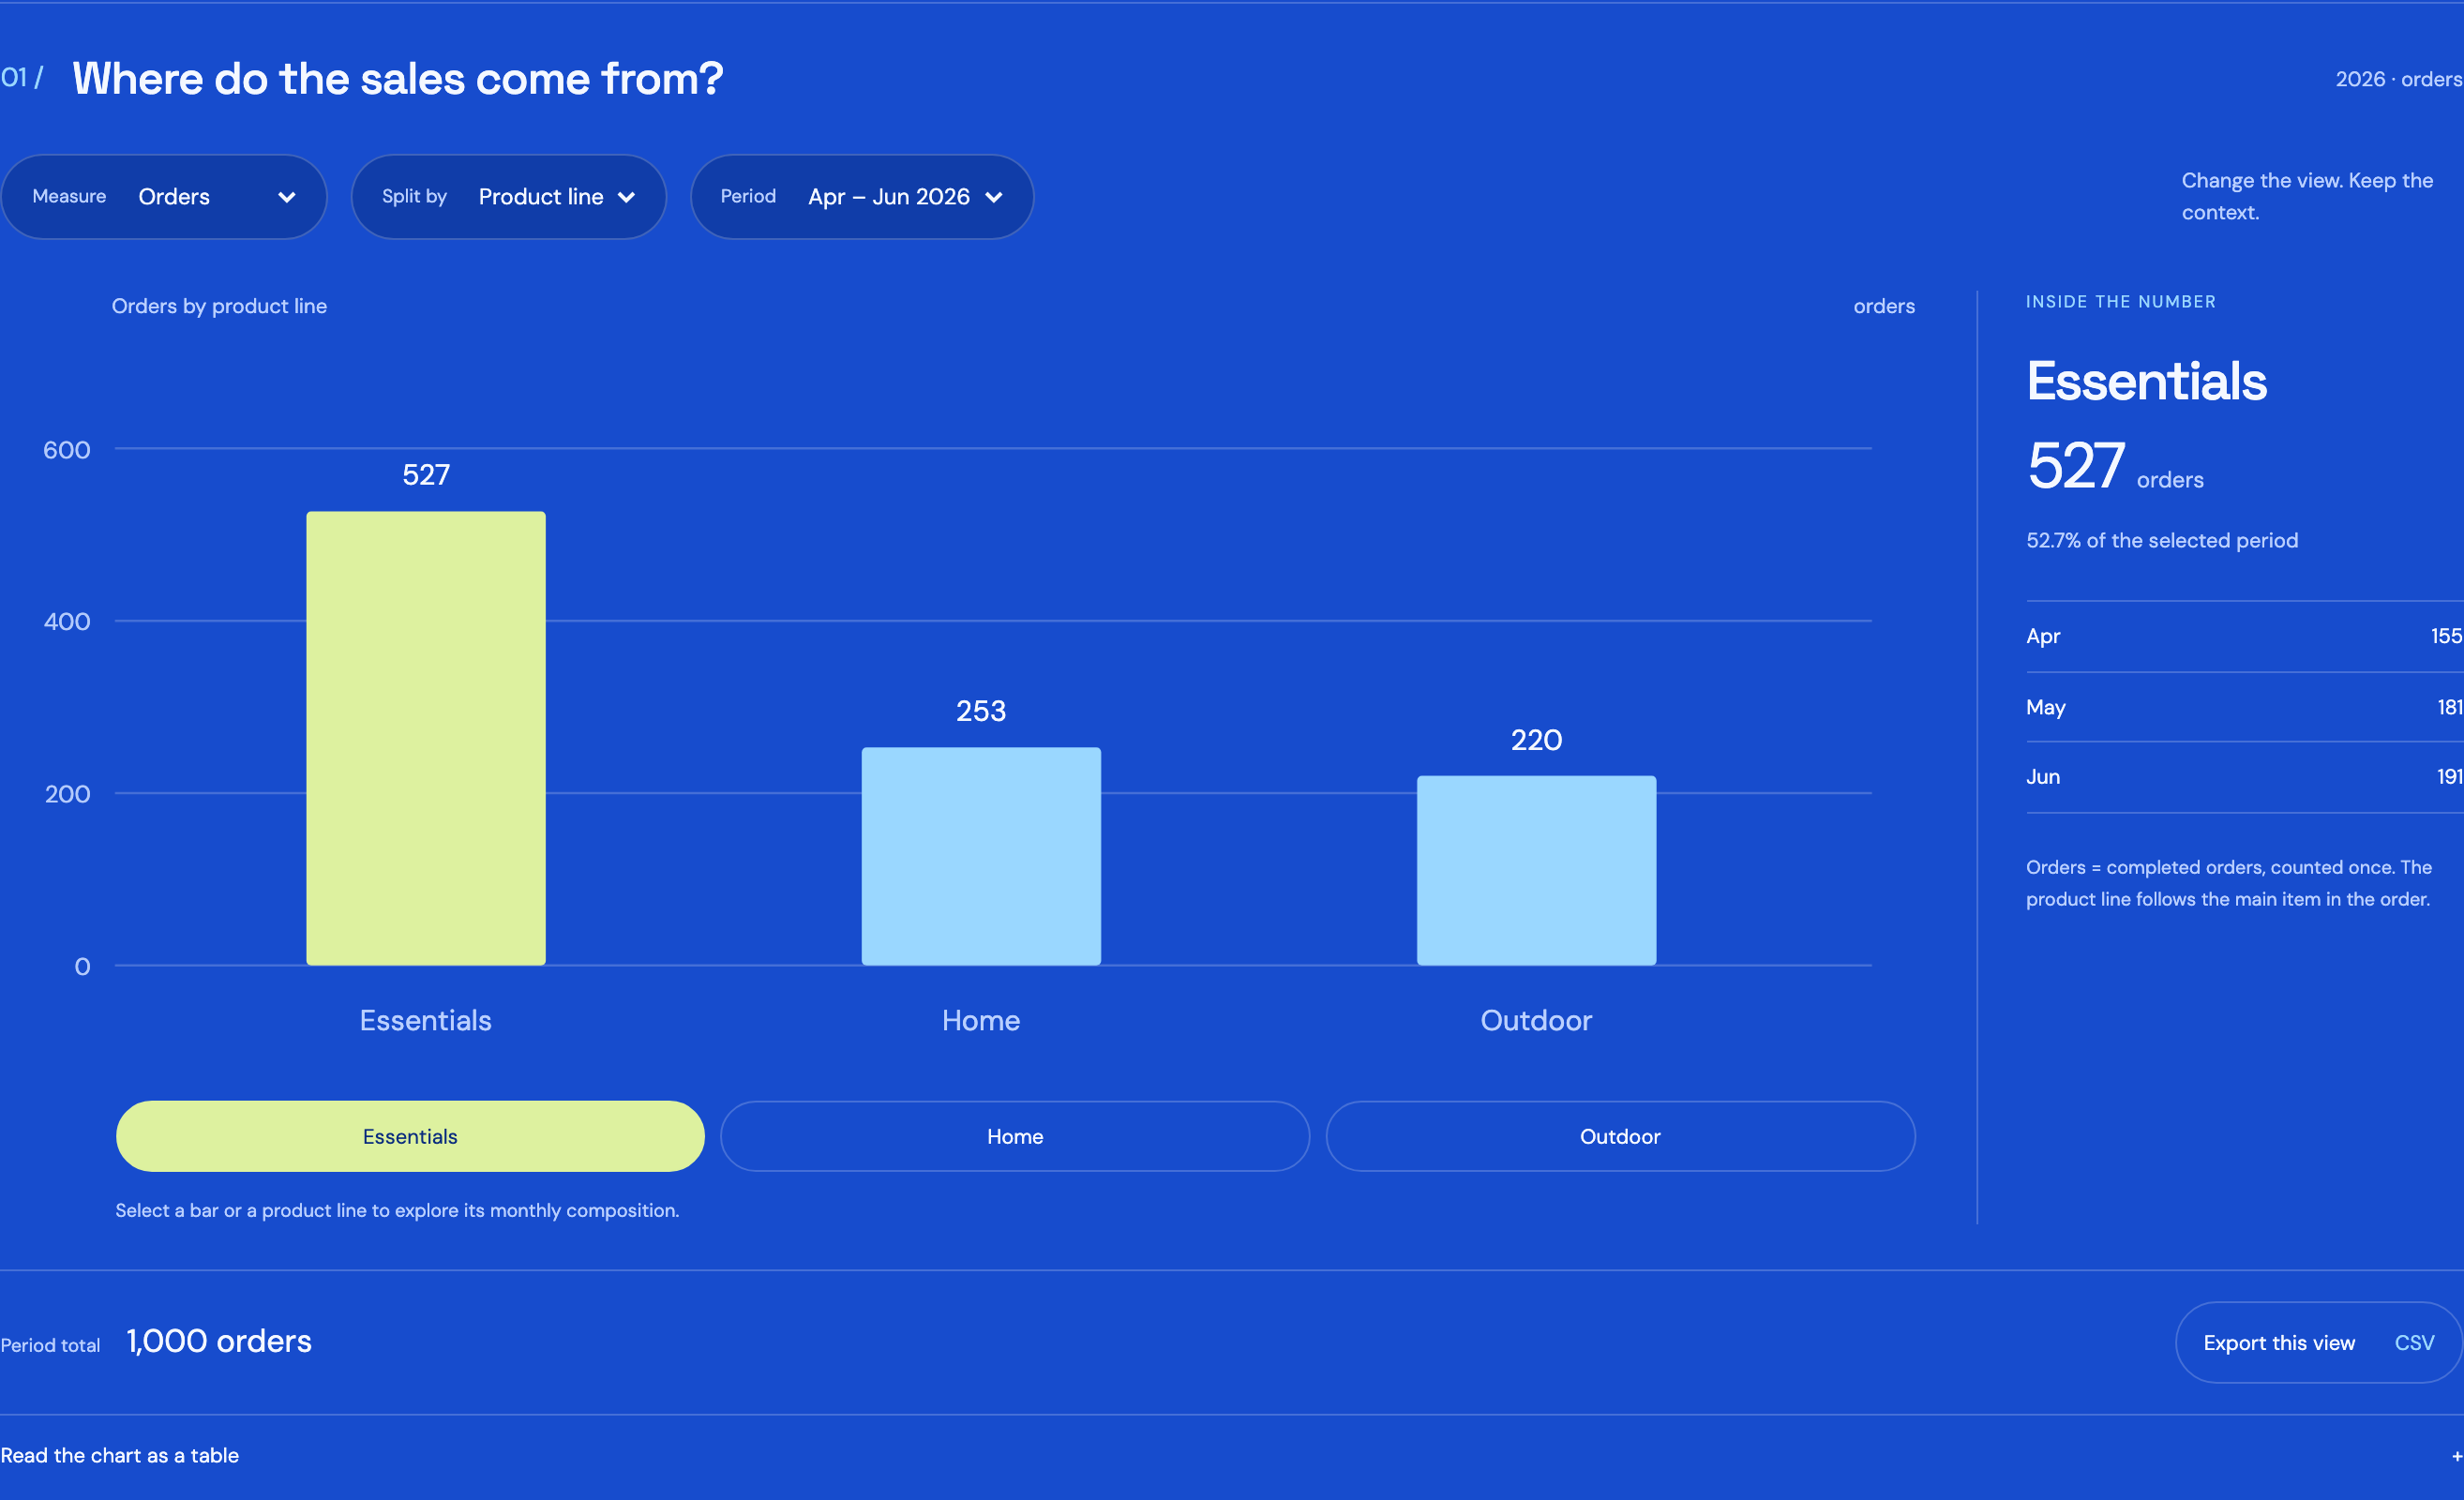
A monthly total tells you when. A product view tells you where. A useful report lets you move between the two without losing the definition behind the number.
Explore the chart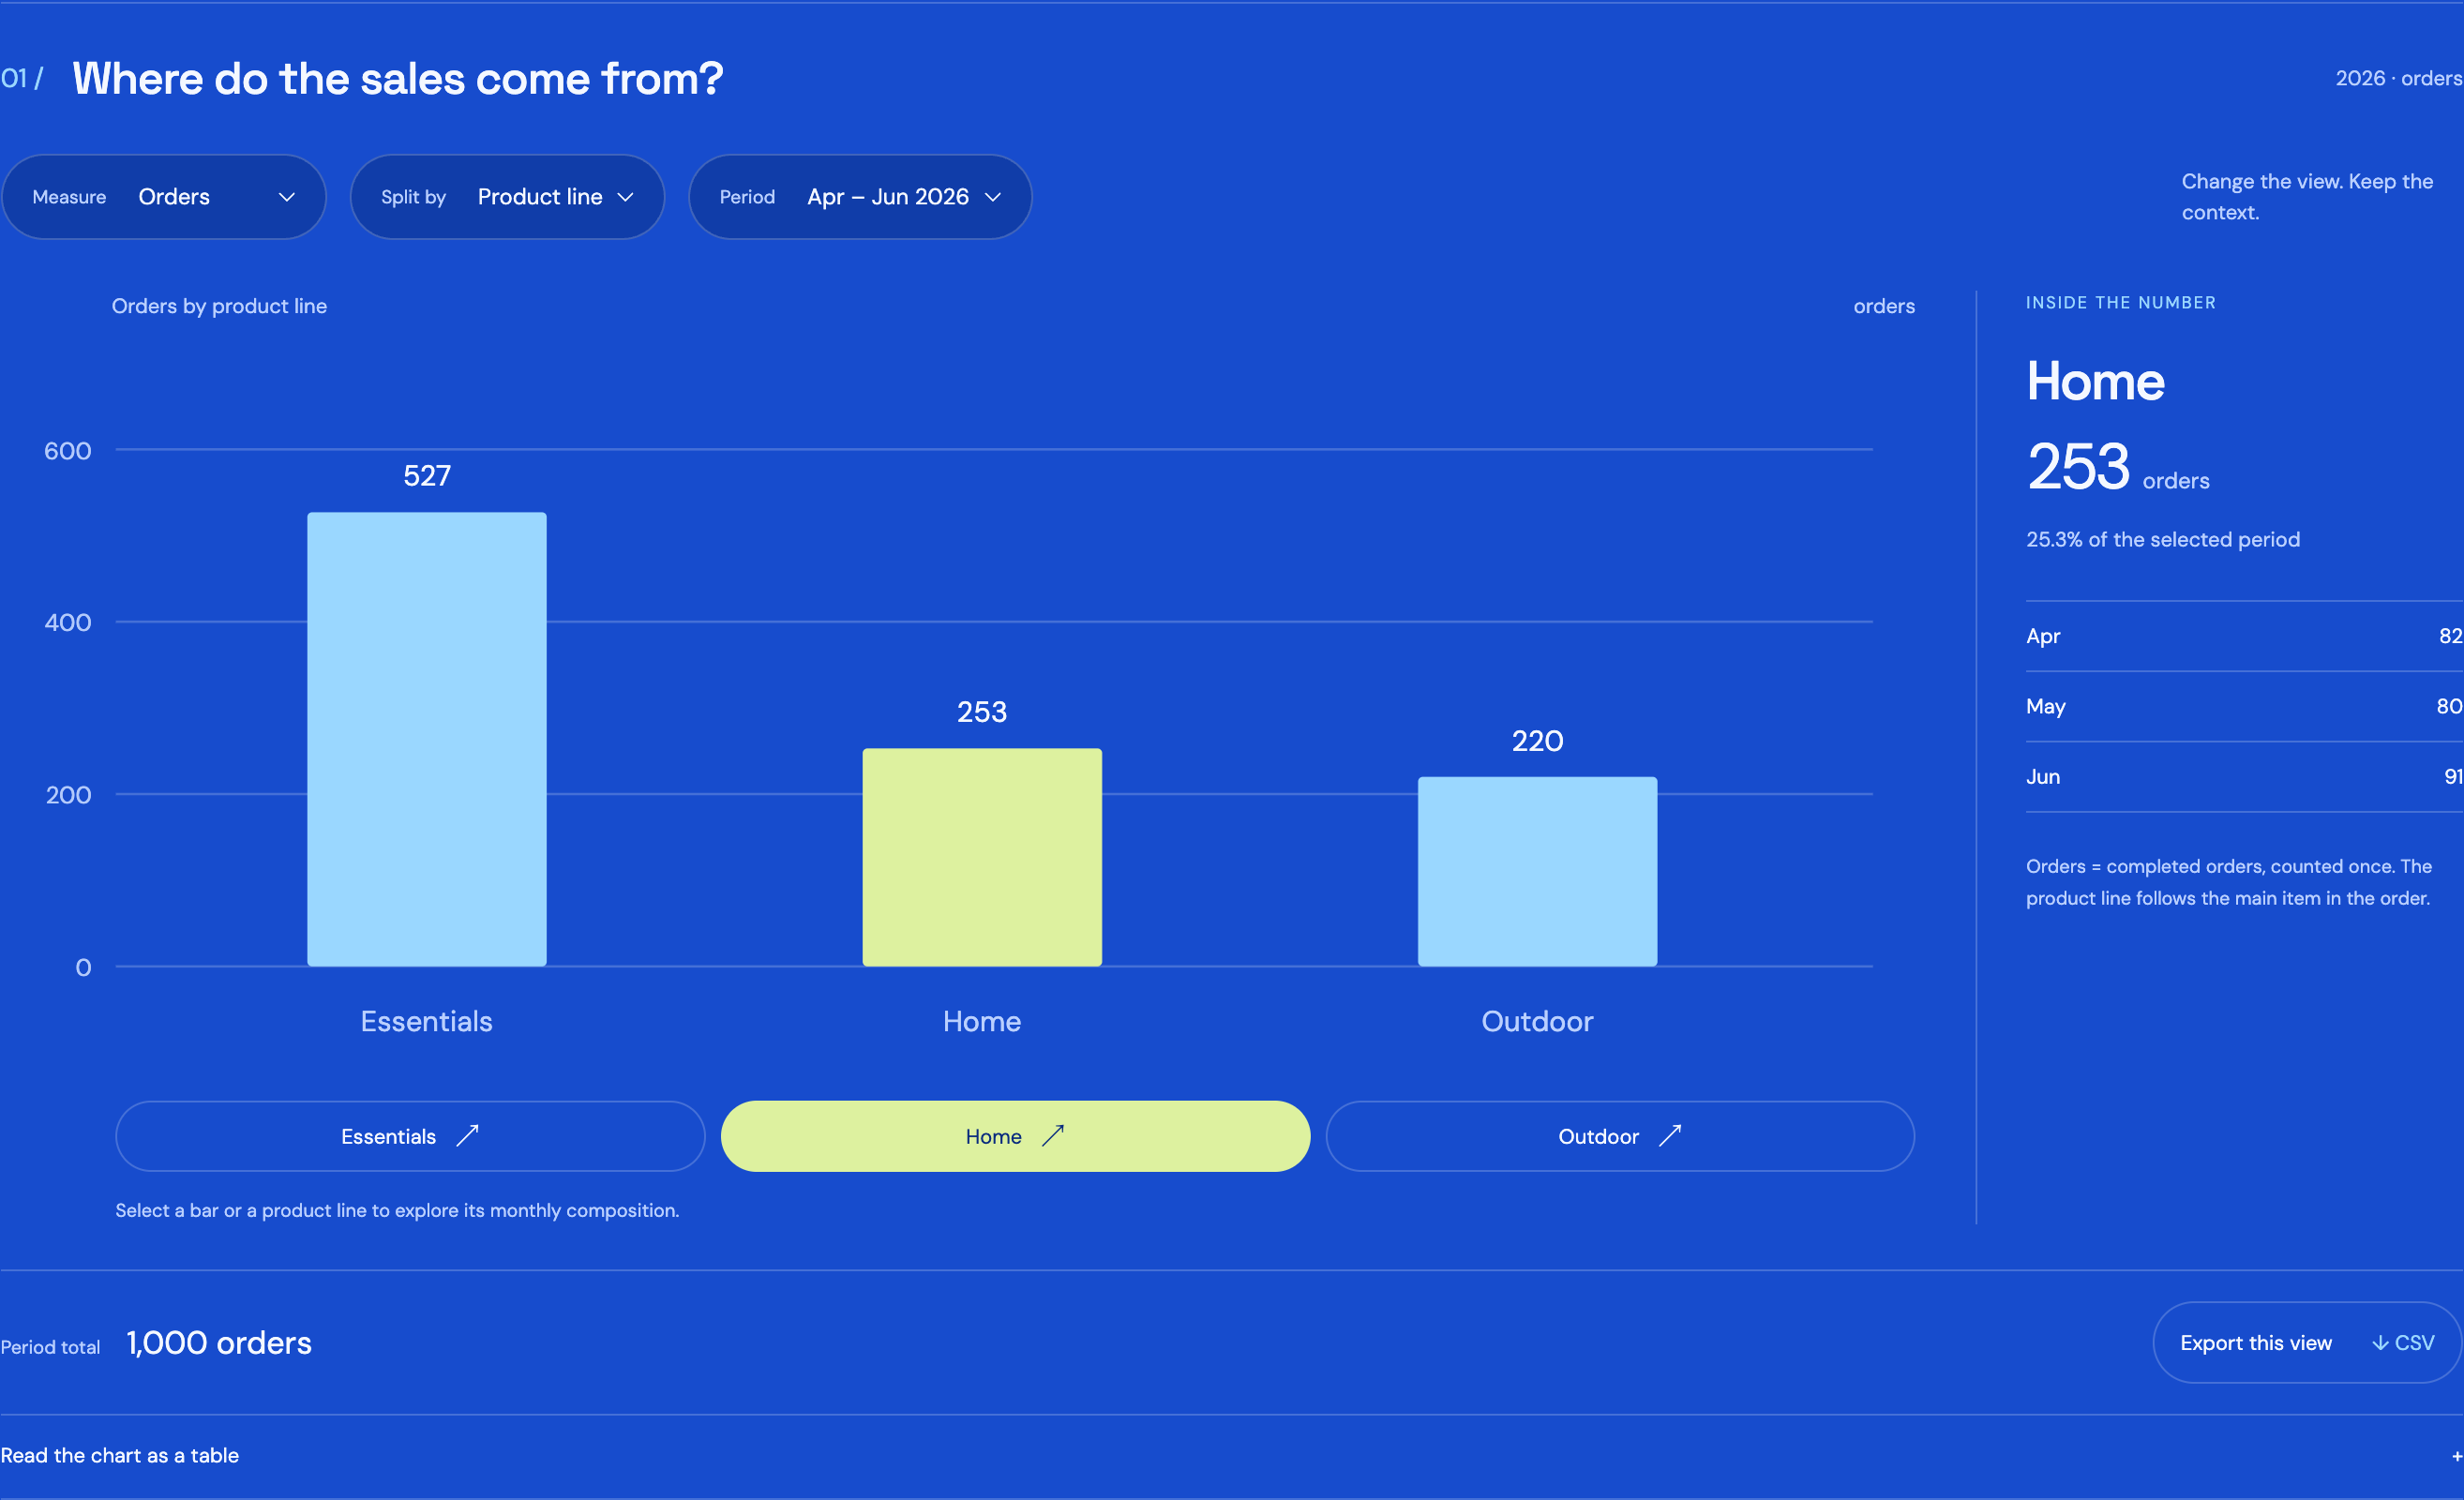
03 / Before the chart
Locate the records in your ERP, sales system or files. Identify the owner, the join keys and the checks that make the dataset usable.
IntegrationsRevenue before or after returns? Orders placed or fulfilled? Write down the calculation, currency, time zone and exclusions before anyone compares totals.
AccountingChoose the refresh window, review owner and delivery format. Scope a dashboard, a recurring report or a structured export around the people who use it.
ERP04 / Your reporting brief
Tell us what you need to decide, where the data lives and who needs the answer. We’ll scope the reporting work with you.
Request a reporting quote Register interest in accessDecisions we make together
Available for project scoping. Access and delivery are agreed after reviewing your requirements.
A closer look